GAPP Economics and Policy Advisor, Ron Rogness , June 09, 2022
Get the Details Behind the Per Capita Consumption of Wild Alaska Pollock in the U.S.
Each year, the National Oceanic and Atmospheric Administration (NOAA) announces the annual U.S. seafood per capita consumption that is quickly followed by the National Fisheries Institute’s (NFI’s) Top 10 Seafood items in terms of per capita consumption. These numbers are often interpreted as measurements of the health of the seafood market in the U.S., or the relative strength of the market for one species versus another.
I want to use this blog post to explain how the per capita consumption of Wild Alaska Pollock/Pollock is calculated, what are the potential sources of error, how consumption of Wild Alaska Pollock and pollock have changed over the years, and finally why per capita consumption is not necessarily the best measurement of the actual demand for Wild Alaska Pollock.
First a confession. I started the NFI Seafood Top 10 back in 1988 when I was working for NFI. Lee Weddig, the Executive Director of NFI at the time, was looking for something to build media coverage off of the annual NOAA overall seafood per capita consumption announcement. There have been some refinements since that time, but the model is basically the same today as it was in 1998. Per capita consumption is essentially a product disappearance model where the equation is (catch – exports + imports), all converted to edible weight.
For most species, one of the largest potential sources of error are the conversion factors, both from live (aka catch weight) to edible weight and from import and export product weight (e.g. headed and gutted) to edible weight. For Alaska Pollock, that potential error is relatively small compared to other species for three reasons. First, and most importantly, Alaska Pollock is somewhat unique in that the NOAA’s Alaska Region collects and publishes detailed information on the actual production of the various products made from Wild Alaska Pollock. This enables us to avoid having to use yield estimates to determine the edible weight of the catch of Wild Alaska Pollock.
Second, the categories of imports and exports are fairly well-aligned with the actual edible weights, although there do need to be adjustments to account for the non-fish ingredients in surimi, and also headed and gutted exports and imports have to be adjusted to edible weight. Finally, there is the question of whether to count imports and exports of categories called “fish sticks and portions.” These categories are not species-specific and it is unclear how much of the volume of these imports and exports are made from Wild Alaska Pollock or Pollock. While it is likely the exports and imports within these categories do include Pollock/Alaska Pollock, they also may well include substantial volumes of products made from other species.
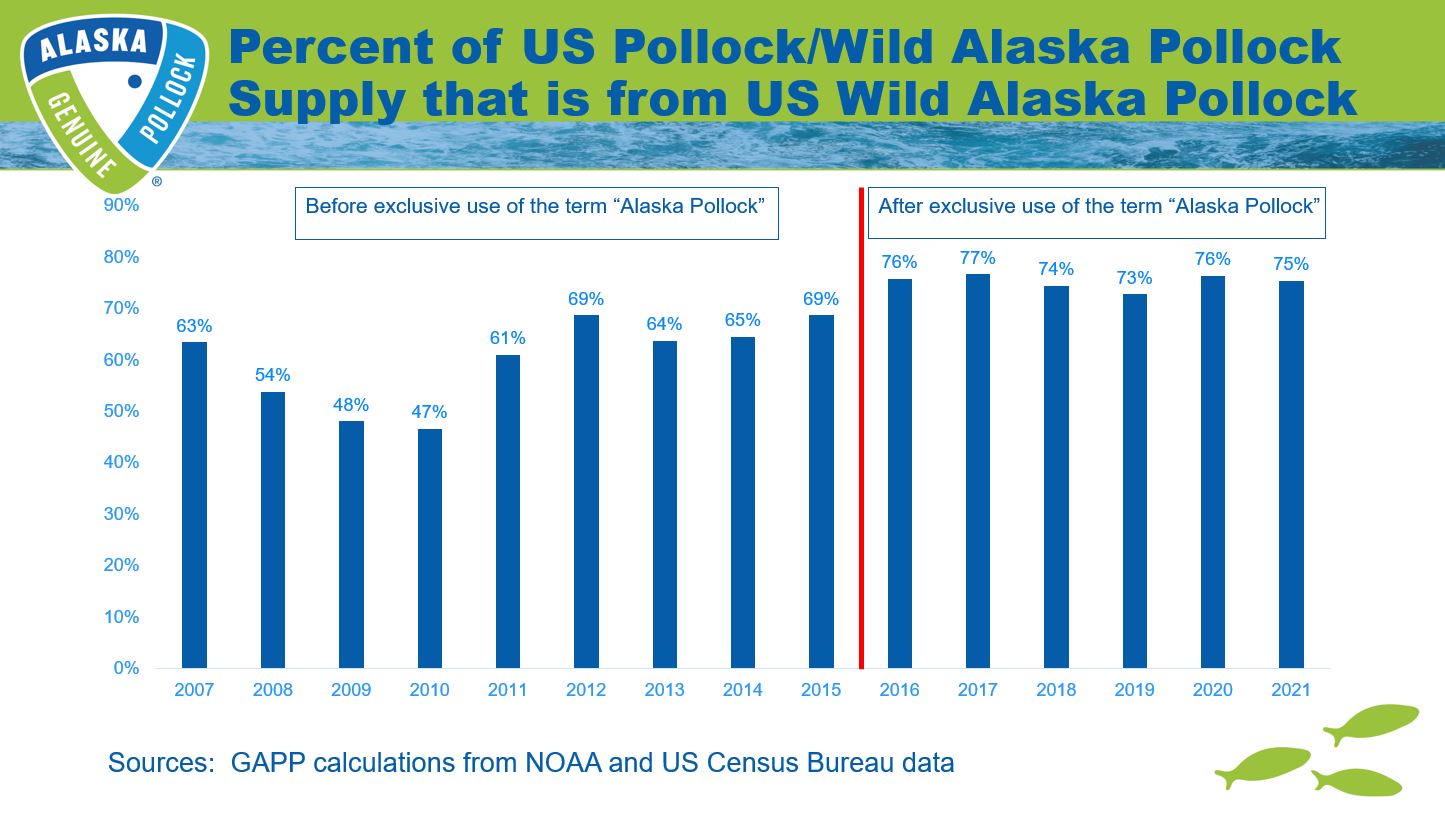
U.S. per capita consumption of Wild Alaska Pollock and imported pollock has fluctuated over the years. According to the NFI numbers, the per capita consumption of pollock/Alaska pollock has steadily ranked 4th or 5th in terms of top species although it has declined fairly steadily, dropping from over 1.454 pounds in 2009 to most recently, 0.88 pounds in 2021. That decline is virtually all due to decreases in imported pollock. In 2009, a year when catches of U.S. Wild Alaska Pollock was low due to reduced quotas to protect the health of the stocks, the U.S. consumed almost 86 thousand mt of imported pollock. By 2021, that has fallen to just over 28 thousand mt. Over that same time span and not counting imports and exports of “fish sticks and portions,” the consumption of U.S.-origin Wild Alaska Pollock increased from 75 thousand mt to 86 thousand mt. Thus, the percentage of the total imported pollock/U.S. Wild Alaska Pollock consumption that is of U.S. origin has increased dramatically, from 48 percent in 2009 to over 75 percent in 2021. Notably, that percentage is markedly different for the period before the U.S. industry obtained exclusive rights to the name “Alaska Pollock in the U.S. in 2016. Prior to that year, U.S. Alaska pollock averaged less than 60% of the total supply. From 2016 through last year, it has averaged more than 75 percent of the total supply.
Now to the last question. That is, “Is per capita consumption the best measurement of the demand for Wild Alaska Pollock?” My quick answer to that question is no. In saying this, I want to make it clear that I don’t suggest that per capita consumption is not important. It is. There are many great reasons why Americans should eat more Wild Alaska Pollock (e.g. personal health, sustainability of the resource and Wild Alaska Pollock’s remarkably low carbon footprint) and also very good reasons for the U.S. industry to encourage it (e.g. the exclusive use of the name “Alaska Pollock” in the US, avoid the vulnerability to foreign exchange fluctuations, and the relative ease of selling into the domestic market). However, Wild Alaska Pollock products have always been in high demand overseas and exports have made up the lion’s share of domestic production. For example, in the five years from 2017 to 2021, 72 percent of US Wild Alaska Pollock fillet production has been exported whereas 88 percent of surimi production was exported over that same time period.
But per capita consumption does not equate to demand as there is no consideration of price. I often hear comments about how fish is not as important as other meat proteins because per capita consumption of seafood is a fraction of beef and chicken. For total seafood, a better comparison is what consumers are spending on seafood relative to other proteins. NOAA used to publish with its Fisheries of the United States Report, the estimated amount consumers spend on seafood. The last reported figure was $102.2 billion in 2017. On its website, the National Chicken Council reported consumer expenditures on chicken in 2018 totaled $95 billion.
While we don’t have consumer expenditures for Wild Alaska Pollock, we do have the processed value and processed product prices. I used the export prices of the various Alaska Pollock products and applied them to the total production to calculate a weighted average price across all product forms. From 2017 to 2021, that weighted average price increased by more than 14 percent. Over that same time period, the Producer Price Index (PPI) for all packaged and prepared seafood increased by 6 percent and the PPI for slaughtered poultry increased by 12 percent.
So what can we take away from all this? Here’s a few conclusions:
- Let’s not fret about overall seafood per capita consumption as it compares to other meat. Money talks and consumers spend plenty on seafood;
- While domestic consumption over combined pollock and Wild Alaska Pollock has declined since 2009, U.S. consumption of Wild Alaska Pollock has fared quite well; and
- U.S. consumers are increasingly eating higher quality single-frozen Wild Alaska Pollock and that is something to celebrate and bodes very well for the future demand for Wild Alaska Pollock products in the United States.